CentOS下安装Munin监控服务器运行情况

1、切换到epel源
各版本对应命令如下:
CentOS 5.x 32bit
rpm -ivh http://dl.fedoraproject.org/pub/epel/5/i386/epel-release-5-4.noarch.rpm
rpm --import /etc/pki/rpm-gpg/RPM-GPG-KEY-EPEL-5
yum -y install yum-priorities
CentOS 5.x 64bit
rpm -ivh http://dl.fedoraproject.org/pub/epel/5/x86_64/epel-release-5-4.noarch.rpm
rpm --import /etc/pki/rpm-gpg/RPM-GPG-KEY-EPEL-5
yum -y install yum-priorities
CentOS 6.x 32bit
rpm -ivh http://dl.fedoraproject.org/pub/epel/6/i386/epel-release-6-8.noarch.rpm
rpm --import /etc/pki/rpm-gpg/RPM-GPG-KEY-EPEL-6
yum -y install yum-priorities
CentOS 6.x 64bit
rpm -ivh http://dl.fedoraproject.org/pub/epel/6/x86_64/epel-release-6-8.noarch.rpm
rpm --import /etc/pki/rpm-gpg/RPM-GPG-KEY-EPEL-6
yum -y install yum-priorities
2、安装Munin服务端、客户端
因为我只监控本机,不监控其他VPS,所以直接执行:
yum -y install munin munin-node

安装完成
3、配置虚拟主机
因为Munin生成的全是静态文件,LANMP架构下我用的是Nginx,打开nginx/conf/vhost建立虚拟主机文件,这点根据自己实际的运行环境写,我的是这样:
server {
        listen       80;
        server_name vps.94cb.com;
        root /www/web/vps/public_html;
        index  index.html index.php index.htm;
        error_page  400 /errpage/400.html;
        location ~ \.php$ {
                proxy_pass http://127.0.0.1:88;
                include naproxy.conf;
        }
        location / {
                try_files $uri @apache;
        }
        location @apache {
                 proxy_pass http://127.0.0.1:88;
                 include naproxy.conf;
        }
}
因为Munin要往这里写入文件,一般这个目录是www用户才有写权限的,因此要给munin写权限,为了方便我直接执行:
chmod -R 777 /www/web/vps/public_html
4、修改Munin配置
执行指令编辑Munin配置文件
vi /etc/munin/munin.conf
可以看到配置文件开头一部分是这样的。我们去掉目录配置前面的注释符,并且修改htmldir为实际的虚拟主机路径,我Nginx中指定的路径是/www/web/vps/public_html
# The next three variables specifies where the location of the RRD
# databases, the HTML output, logs and the lock/pid files.  They all
# must be writable by the user running munin-cron.  They are all
# defaulted to the values you see here.
#
#dbdir  /var/lib/munin
#htmldir /var/www/html/munin
#logdir /var/log/munin
#rundir  /var/run/munin
修改后是这样的:
# The next three variables specifies where the location of the RRD
# databases, the HTML output, logs and the lock/pid files.  They all
# must be writable by the user running munin-cron.  They are all
# defaulted to the values you see here.
#
dbdir  /var/lib/munin
htmldir /www/web/vps/public_html
logdir /var/log/munin
rundir  /var/run/munin
5、启动Munin并设置开机自启
执行以下语句启动:
/etc/init.d/munin-node start

执行以下语句添加服务并开机自启:
chkconfig --add munin-node
chkconfig munin-node on
5分钟后打开你在Web服务器中设置的虚拟主机(例如http://vps.94cb.com),可以看到效果。
想马上看到的话可以直接执行(munin-cron是munin的定时任务,5分钟调用一次,手动调用的话可以直接生成统计结果的静态网站,只能以munin用户启动),不急的就别管了。
su - munin --shell=/usr/bin/munin-cron
下面是Munin运行之后生成的统计图。


Munin还有很多插件,安装教程可以看这里:
http://gallery.munin-monitoring.org/
我也会在下面继续演示一些我需要用到的插件的安装。

添加Nginx监控
首先要确定Nginx已经编译了nginx_status这个模块,如果没有的话,要在编译时加入这个参数
--with-http_stub_status_module
如果有的话,进行下一步:
先建立一个软连接:
ln -s /usr/share/munin/plugins/nginx_request /etc/munin/plugins
ln -s /usr/share/munin/plugins/nginx_status /etc/munin/plugins
打开/新建一个VirtualHost,这里举例的配置文件是:Nginx目录/conf/vhost/vps.94cb.com.conf,添加:
        location /nginx_status {
                stub_status on;
                access_log   off;
                allow 127.0.0.1;
                deny all;
        }
我的是LANMP架构,所以最后整个vps.94cb.com.conf文件是这样的:
    server {
        listen       80;
        server_name  vps.94cb.com;
        root /www/web/default;
        index index.php index.html index.htm;
		location /nginx_status {
		stub_status on;
		access_log   off;
		allow 127.0.0.1;
		deny all;
        }
        location ~ \.php$ {
		proxy_pass http://127.0.0.1:88;
		include naproxy.conf;
        }
        location ~ .*\.(gif|jpg|jpeg|png|bmp|swf)$ {
                expires      30d;
        }

        location ~ .*\.(js|css)?$ {
                expires      12h;
        }
    }
这个脚本打开了Nginx的统计信息,并且使得统计信息只能从本机内部访问。
然后编辑Nginx配置文件:
vi /etc/munin/plugin-conf.d/munin-node.conf
在配置文件中添加如下设置:
[nginx*]
env.url http://vps.94cb.com/nginx_status
同样执行一下测试语句:
/usr/sbin/munin-run nginx_status
/usr/sbin/munin-run nginx_request
如果看到类似结果,说明成功:
[root@vps tmp]# /usr/sbin/munin-run nginx_status
total.value 7
reading.value 0
writing.value 3
waiting.value 4
[root@vps tmp]# /usr/sbin/munin-run nginx_request
request.value 1477

保存退出,重启Nginx和Munin
service nginxd restart
service munin-node restart
等待一段时间后,打开http://vps.94cb.com 可以观察到Nginx的统计情况,包括连接数、每秒平均请求数

需要调整绘图尺寸的可以看这里
http://munin-monitoring.org/wiki/faq#Q:Isthereanywaytoincreasethedefaultsizeofthemuningraphs
执行指令编辑Munin配置文件:
vi /etc/munin/munin.conf
在对应区块插入以下设置:
graph_width 1200
graph_height 400
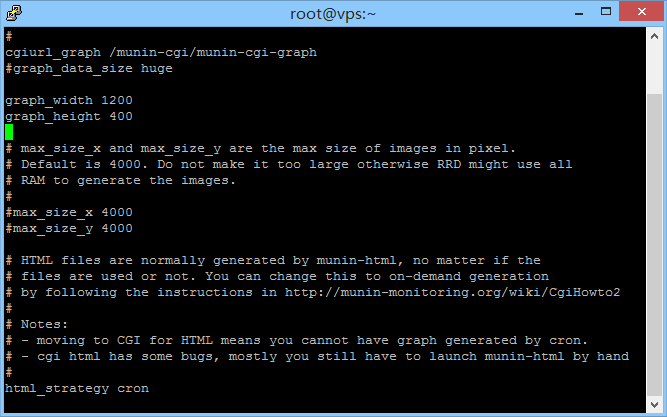
如上图,保存并退出,则可将绘图区域分辨率修改为1200*400,等待数分钟Munin绘图刷新后即可看到效果。
也可以用1楼的办法手动更新,运行:
su - munin --shell=/usr/bin/munin-cron
效果如图:


登录后方可回帖

 粤公网安备 44030602003677号
添加MySQL监控
Munin继续添加MySQL监控,首先执行一个软连接:
进入mysql,添加一个用户:这里我新建的用户用户名为munin
修改Munin配置文件:
插入以下语句并保存,然后退出:
执行以下语句:
如果可以看到类似这样的结果,说明成功:
重启Munin
几分钟后,在浏览器访问你设置的虚拟主机的域名,例http://vps.94cb.com/mysql-day.html 可以看到
点击进去,可以看到每秒执行的SQL语句次数以及类别、3306端口的I/O数据、线程数(MySQL是单进程多线程)等等数据的图表。